1 · The earthquake1 · El terremoto The 2010 Maule earthquakeEl terremoto del Maule de 2010
On 27 February 2010 at 03:34 local time (06:34 UTC), a magnitude Mw 8.8 earthquake struck off the coast of the Maule Region, in south-central Chile. It was produced by thrust faulting on the boundary where the Nazca plate sinks beneath the South American plate, and it ruptured about 500 km of that boundary, between the regions of Maule and Biobío. It was the largest earthquake on this plate boundary since the 1960 Valdivia earthquake (Mw 9.5), and the strong shaking lasted around three minutes. El 27 de febrero de 2010 a las 03:34 hora local (06:34 UTC), un terremoto de magnitud Mw 8,8 ocurrió frente a la costa de la Región del Maule, en el centro-sur de Chile. Se produjo por fallamiento inverso en el límite donde la placa de Nazca se hunde bajo la placa Sudamericana, y rompió cerca de 500 km de ese límite, entre las regiones del Maule y del Biobío. Fue el mayor terremoto en este límite de placas desde el terremoto de Valdivia de 1960 (Mw 9,5), y el movimiento fuerte duró alrededor de tres minutos.
The earthquake generated a tsunami that reached the coast within minutes. Most deaths occurred in the Maule Region, followed by Biobío and the coastal and island areas hit by the tsunami. El terremoto generó un tsunami que llegó a la costa en pocos minutos. La mayoría de las muertes ocurrieron en la Región del Maule, seguida por el Biobío y las zonas costeras e insulares afectadas por el tsunami.
2 · Damage and losses2 · Daños y pérdidas Human and material impactImpacto humano y material
Old adobe buildings suffered severe damage or collapse, and many historic town centres were heavily affected. The tsunami devastated coastal towns such as Constitución, Dichato, Talcahuano and Pichilemu, and in the port of Talcahuano it carried boats and ships inland. In Concepción, the 15-storey Alto Río residential building collapsed. Even so, considering the size of the earthquake, damage from ground shaking to engineered buildings was relatively limited, a result generally attributed to the seismic design policies adopted in Chile after the 1960 earthquake. Las construcciones antiguas de adobe sufrieron daños severos o colapso, y muchos centros históricos resultaron muy afectados. El tsunami devastó localidades costeras como Constitución, Dichato, Talcahuano y Pichilemu, y en el puerto de Talcahuano arrastró embarcaciones y barcos tierra adentro. En Concepción colapsó el edificio residencial Alto Río, de 15 pisos. Aun así, considerando el tamaño del terremoto, el daño por vibración en edificaciones con diseño ingenieril fue relativamente limitado, resultado que se atribuye en general a las políticas de diseño sísmico adoptadas en Chile después del terremoto de 1960.
3 · The record3 · El registro Angol Station accelerogramAcelerograma de la Estación Angol
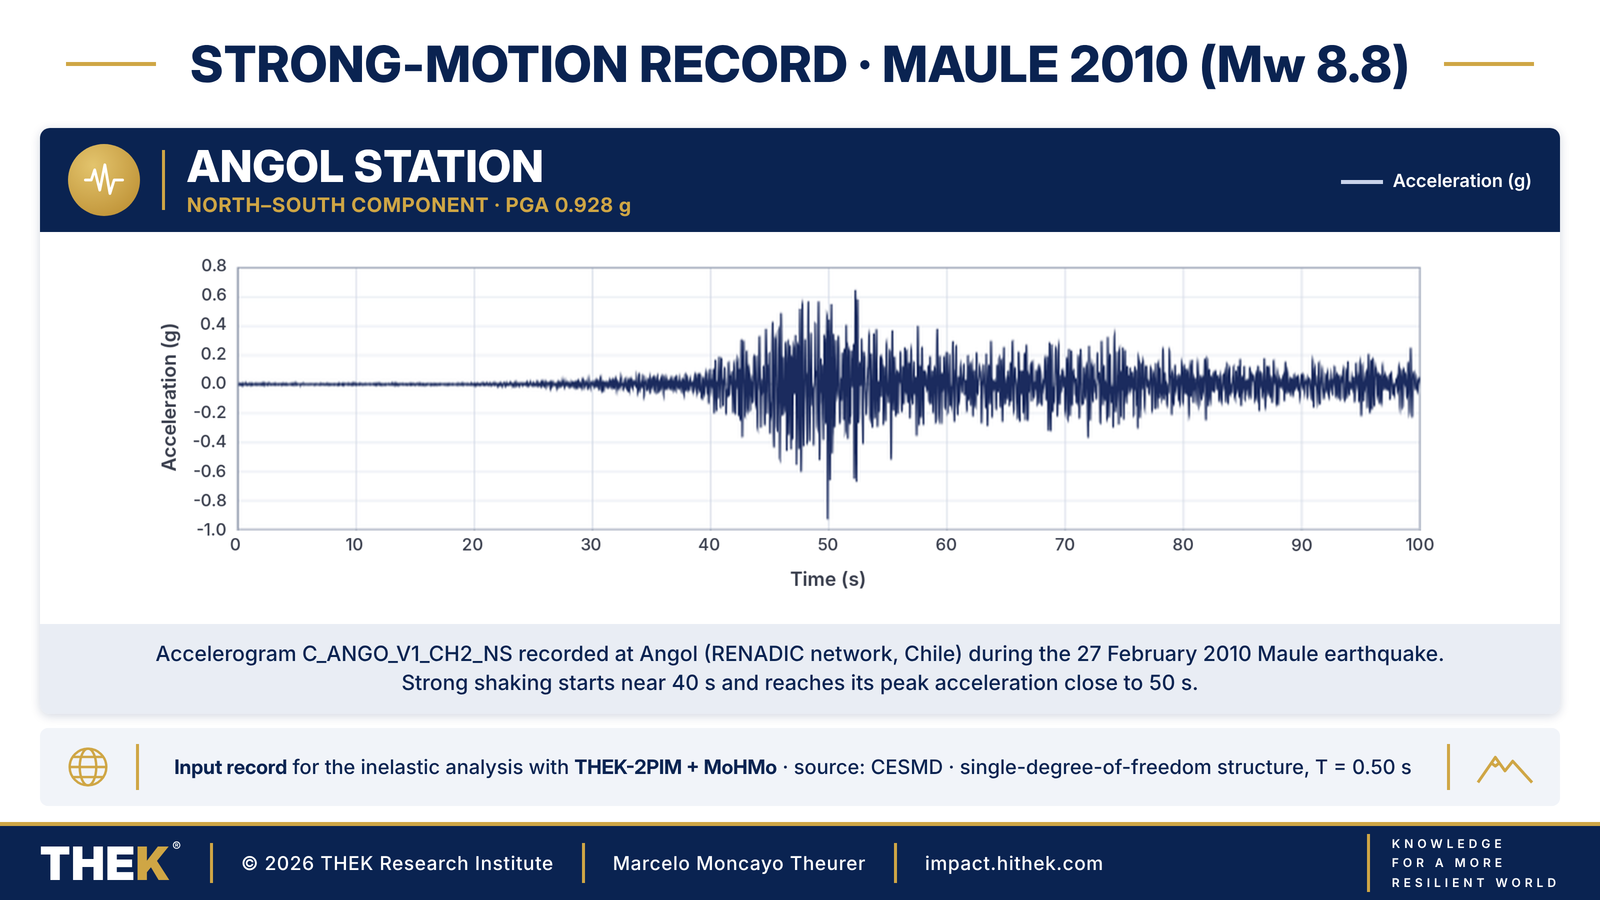
The Angol station (AGCH) belongs to the National Accelerograph Network (RENADIC) of the University of Chile and is located in the Araucanía Region, about 217 km south of the epicentre. Its North–South component recorded the highest peak acceleration of the whole earthquake: RENADIC reported 916 cm/s² (0.935 g, uncorrected). The record used in this study was downloaded from the Center for Engineering Strong Motion Data (CESMD) and processed in the THEK Strong-Motion Lab. La estación Angol (AGCH) pertenece a la Red Nacional de Acelerógrafos (RENADIC) de la Universidad de Chile y se ubica en la Región de la Araucanía, a unos 217 km al sur del epicentro. Su componente Norte–Sur registró la mayor aceleración máxima de todo el terremoto: RENADIC informó 916 cm/s² (0,935 g, sin corregir). El registro utilizado en este estudio se descargó del Center for Engineering Strong Motion Data (CESMD) y se procesó en el THEK Strong-Motion Lab.
img/THEK_Fig01_Maule2010_Accelerogram.png4 · Analysis setup4 · Planteamiento del análisis Single-degree-of-freedom systemSistema de un grado de libertad
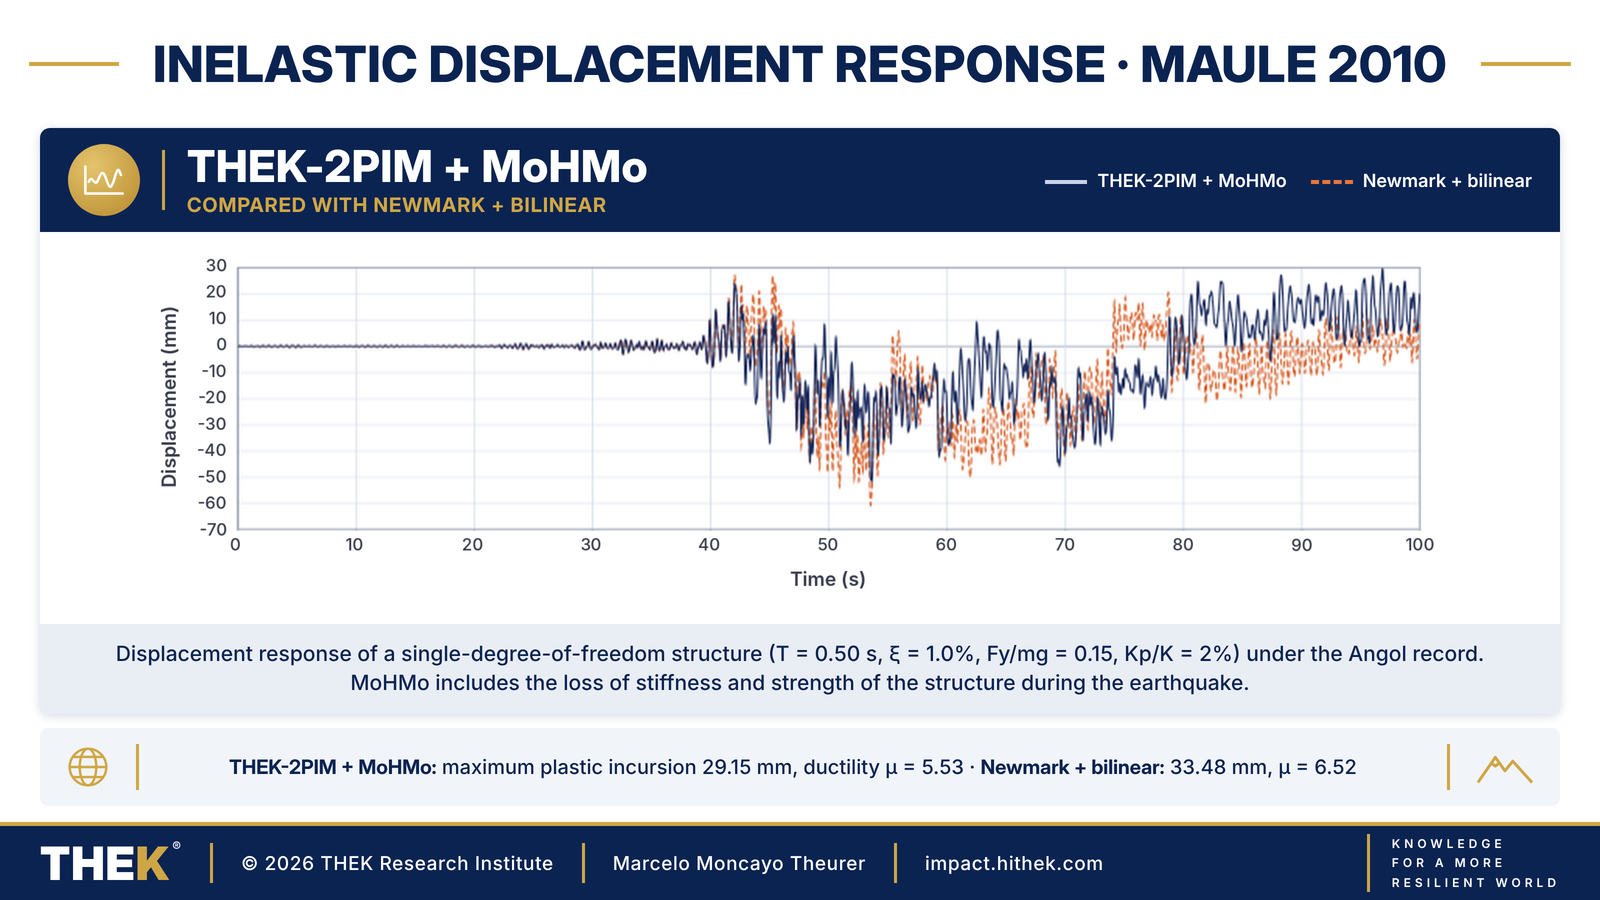
The record is applied to a single-degree-of-freedom structure with a period of 0.50 s. Three models are compared: (a) the Newmark method with a bilinear model, used as reference; (b) THEK-2PIM with the same bilinear model, without degradation; and (c) THEK-2PIM with MoHMo, which includes the degradation of the structure during the earthquake. El registro se aplica a una estructura de un grado de libertad con periodo de 0,50 s. Se comparan tres modelos: (a) el método de Newmark con modelo bilineal, como referencia; (b) THEK-2PIM con el mismo modelo bilineal, sin degradación; y (c) THEK-2PIM con MoHMo, que incluye la degradación de la estructura durante el sismo.
| ParameterParámetro | ValueValor |
|---|---|
| MassMasa m | 1 000 kg |
| Elastic stiffnessRigidez elástica K | 157 914 N/m |
| Natural periodPeriodo natural T | 0.50 s |
| Damping ratioAmortiguamiento ξ | 1.0% |
| Yield strengthResistencia de fluencia Fy / mg | 0.15 |
| Post-yield stiffness ratioRelación de rigidez post-fluencia Kp / K | 2.0% |
| Yield displacementDesplazamiento de fluencia uy | 9.32 mm |
| Record scale factorFactor de escala del registro | 1.00 |
5 · Results5 · Resultados Response, hysteresis, degradation and energyRespuesta, histéresis, degradación y energía
img/THEK_Fig02_Maule2010_Displacement.png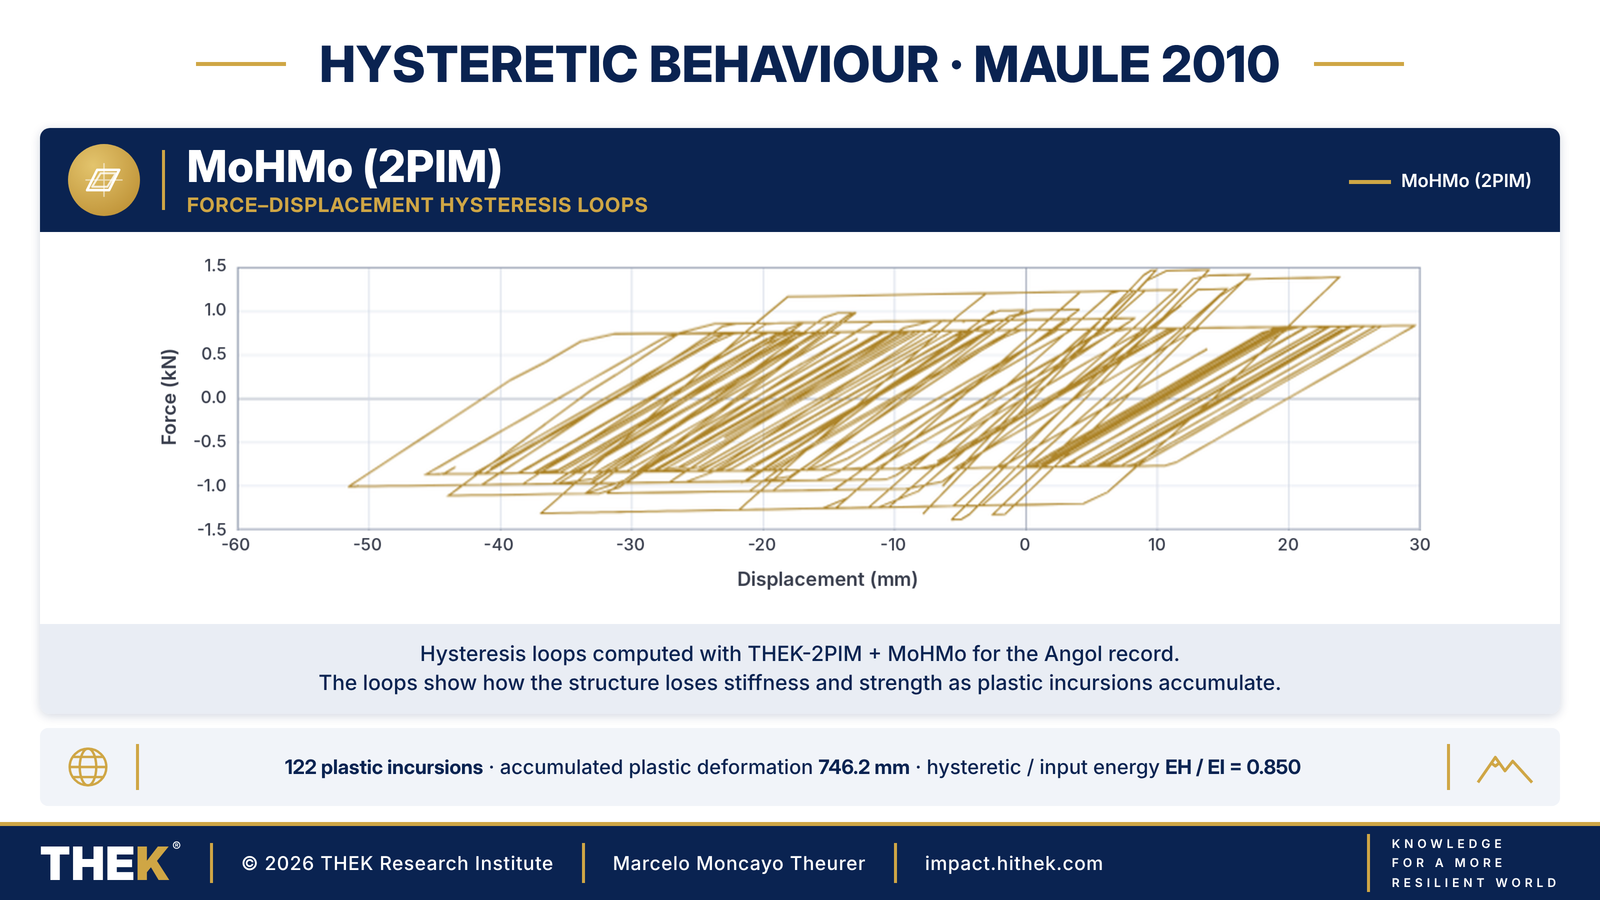
img/THEK_Fig03_Maule2010_Hysteresis.png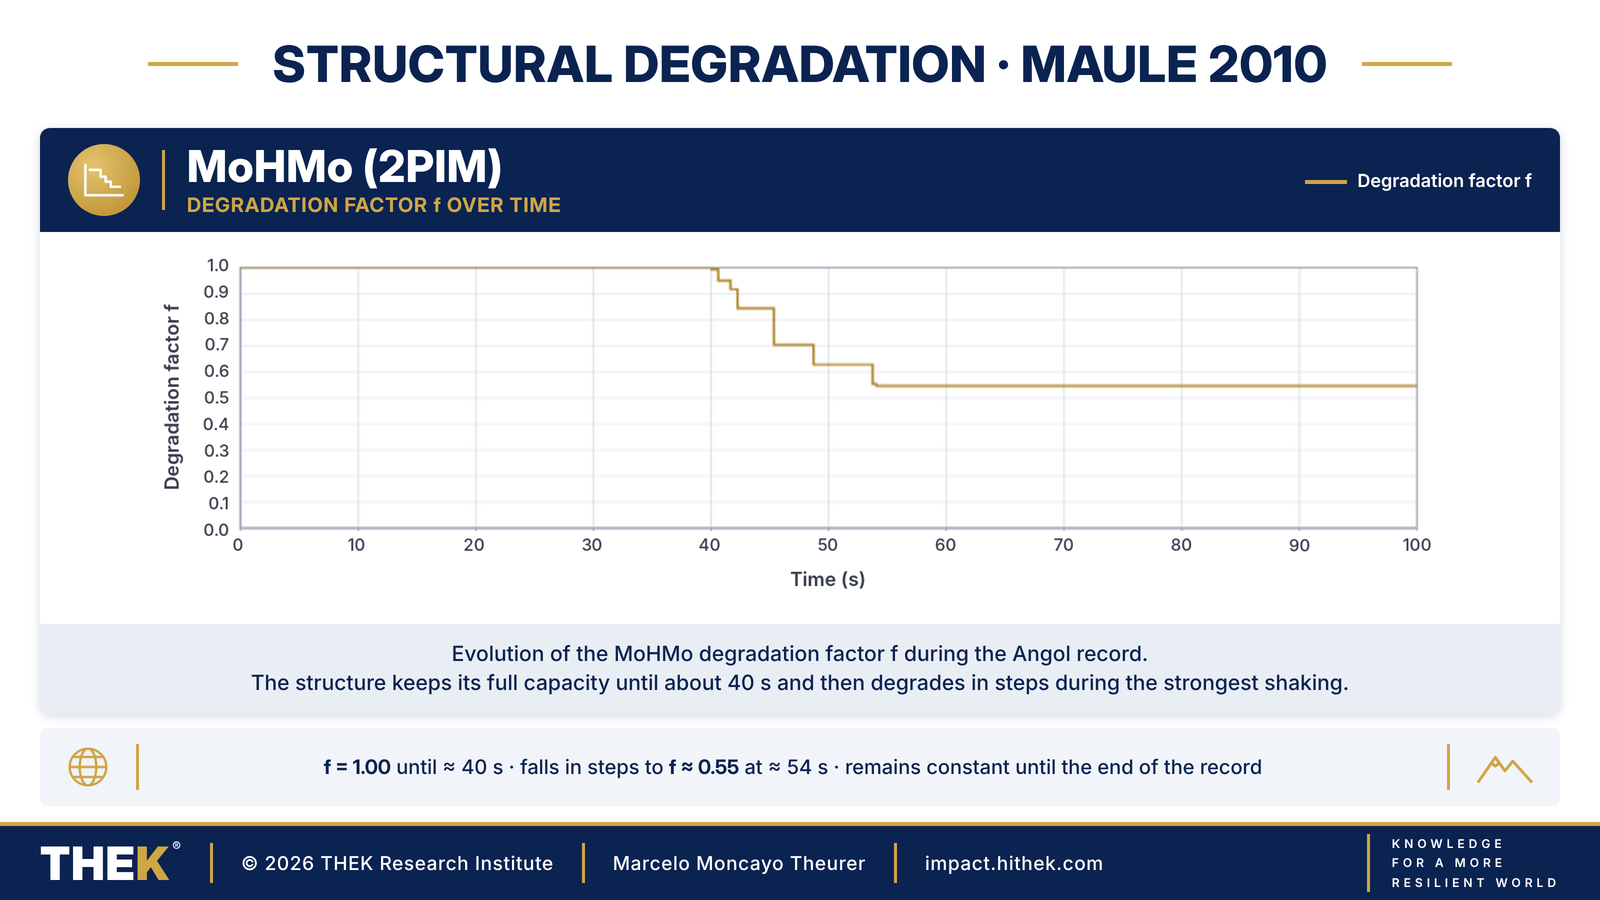
img/THEK_Fig04_Maule2010_Degradation.png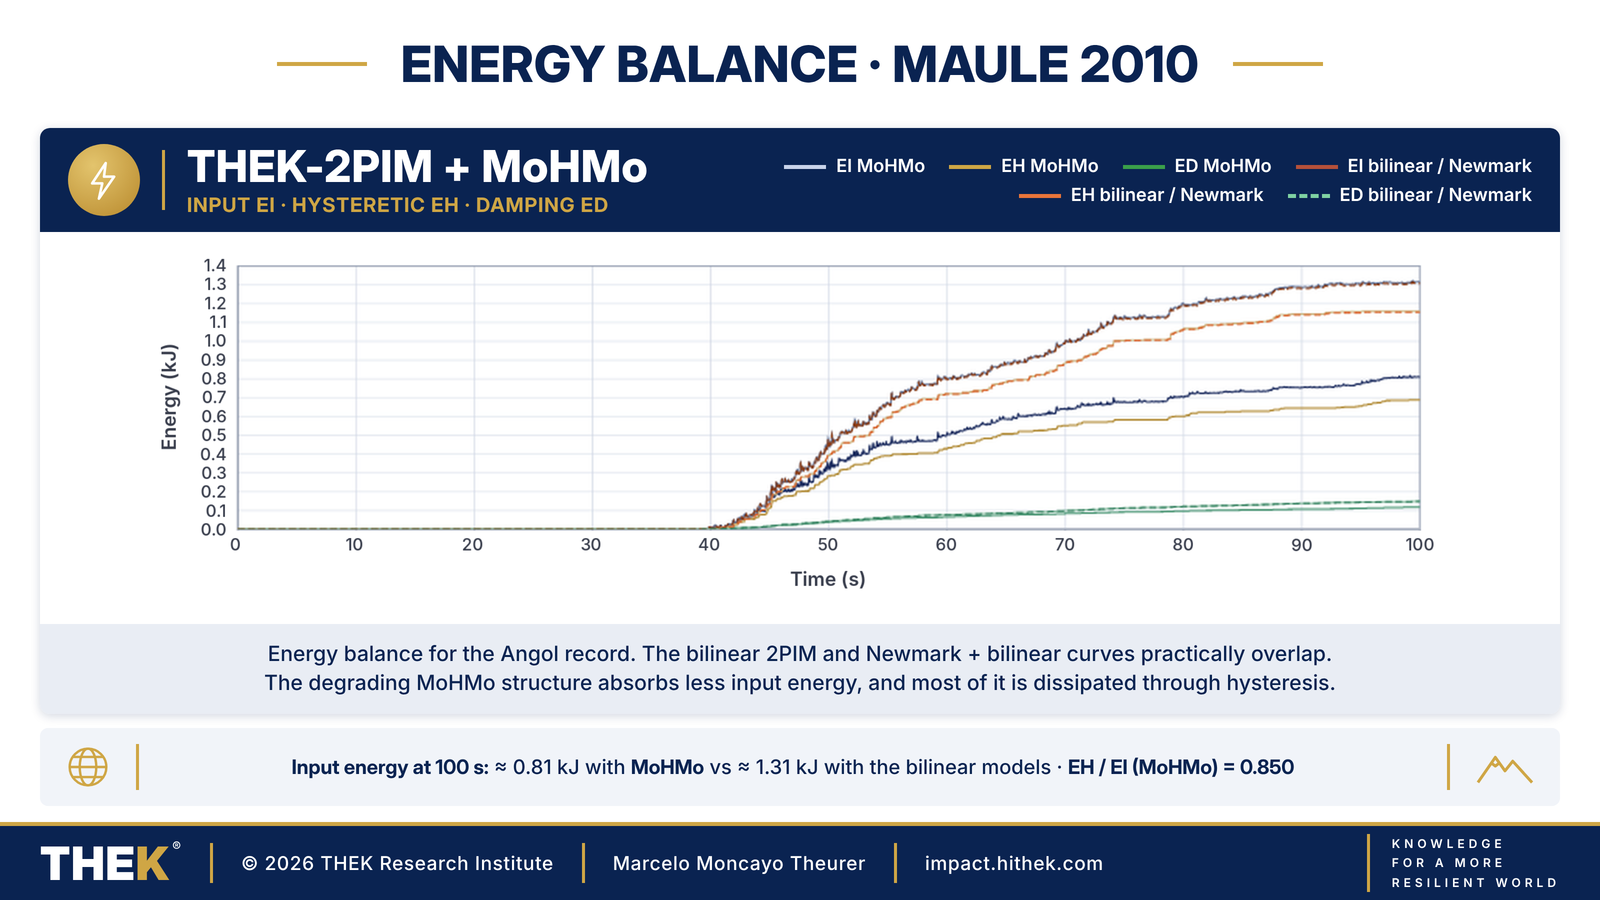
img/THEK_Fig05_Maule2010_Energy.pngPlastic incursions and damage indicatorsIncursiones plásticas e indicadores de daño
| IndicatorIndicador | MoHMo (2PIM) | Bilinear (2PIM)Bilineal (2PIM) | Newmark + bilinearNewmark + bilineal |
|---|---|---|---|
| Plastic incursions (total)Incursiones plásticas (total) | 122 | 137 | 137 |
| · positive / negative· sentido positivo / negativo | 61 / 61 | 74 / 63 | 74 / 63 |
| Maximum incursionMáxima incursión Δup | 29.15 mm | 33.60 mm | 33.48 mm |
| Maximum incursionMáxima incursión Δup / uy | 3.13 | 3.61 | 3.59 |
| Start of maximum incursionInicio de la máxima incursión | 45.10 s | 45.09 s | 45.09 s |
| Accumulated plastic deformationDeformación plástica acumulada Σ|Δup| | 746.2 mm | 791.4 mm | 788.6 mm |
| Accumulated ductilityDuctilidad acumulada Σ|Δup| / uy | 80.11 | 84.95 | 84.65 |
| Displacement ductilityDuctilidad de desplazamiento μ | 5.53 | 6.45 | 6.52 |
| Hysteretic / input energyEnergía histerética / de entrada EH / EI | 0.850 | — | — |
6 · Spectra6 · Espectros Displacement and design spectraEspectros de desplazamiento y de diseño
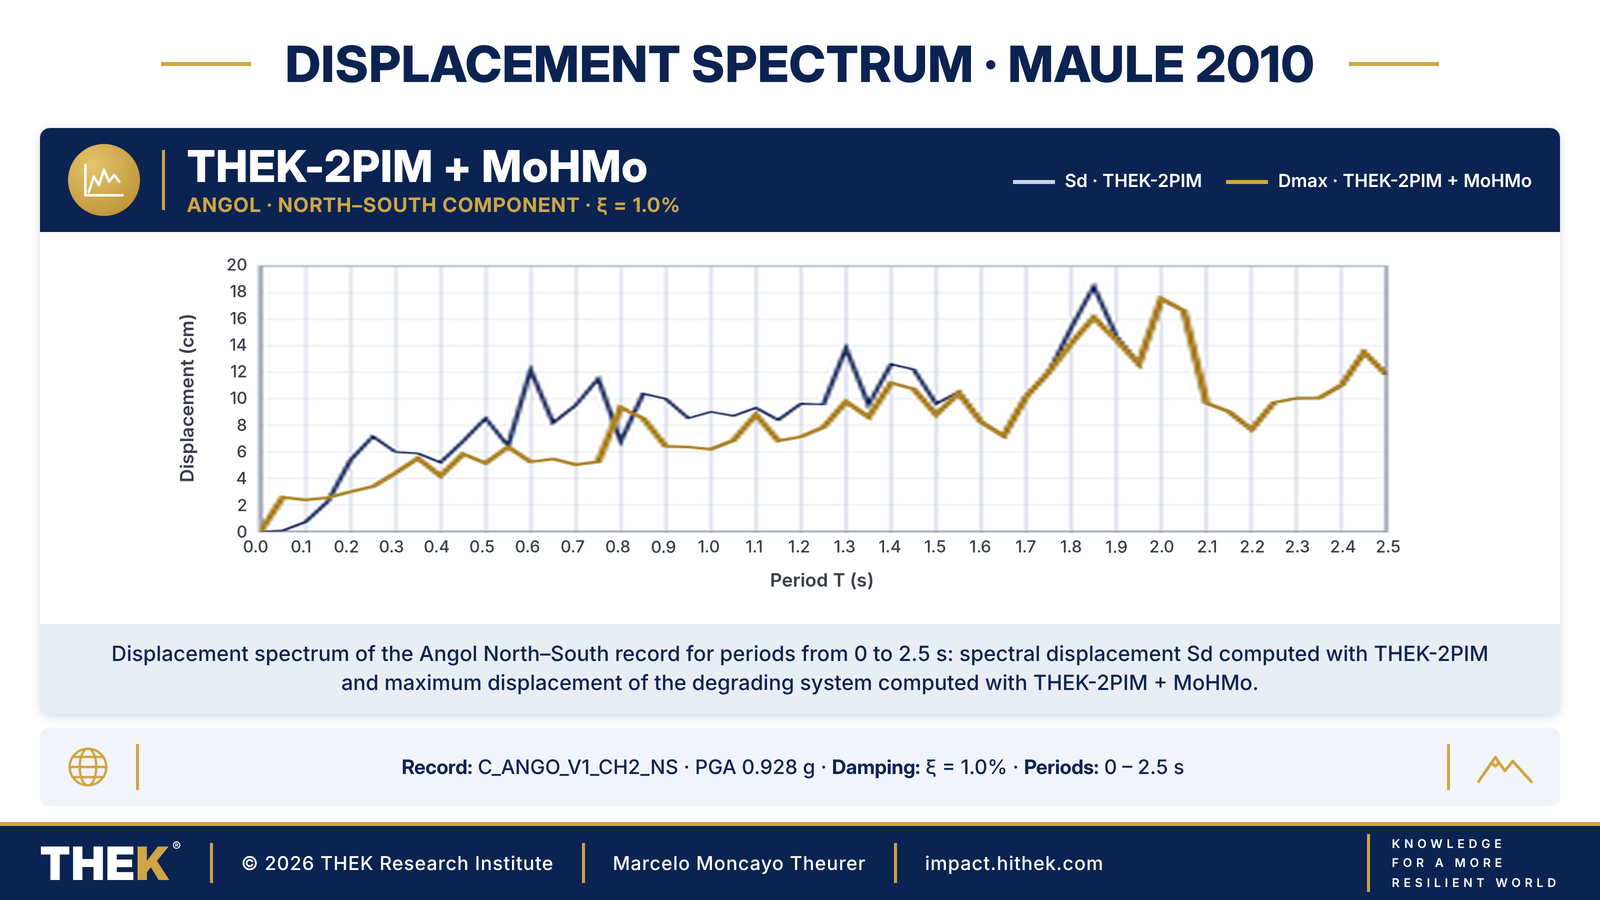
The same record is used to compute spectra for periods from 0 to 2.5 s: the displacement spectrum, the inelastic design spectra DDS (μ – T – η) for both horizontal components, and the comparison between the elastic coefficient Ce and the inelastic design coefficients Cy(T, μ). Con el mismo registro se calculan espectros para periodos de 0 a 2,5 s: el espectro de desplazamiento, los espectros inelásticos de diseño DDS (μ – T – η) para las dos componentes horizontales, y la comparación entre el coeficiente elástico Ce y los coeficientes inelásticos de diseño Cy(T, μ).
img/THEK_Fig06_Maule2010_DisplacementSpectrum.png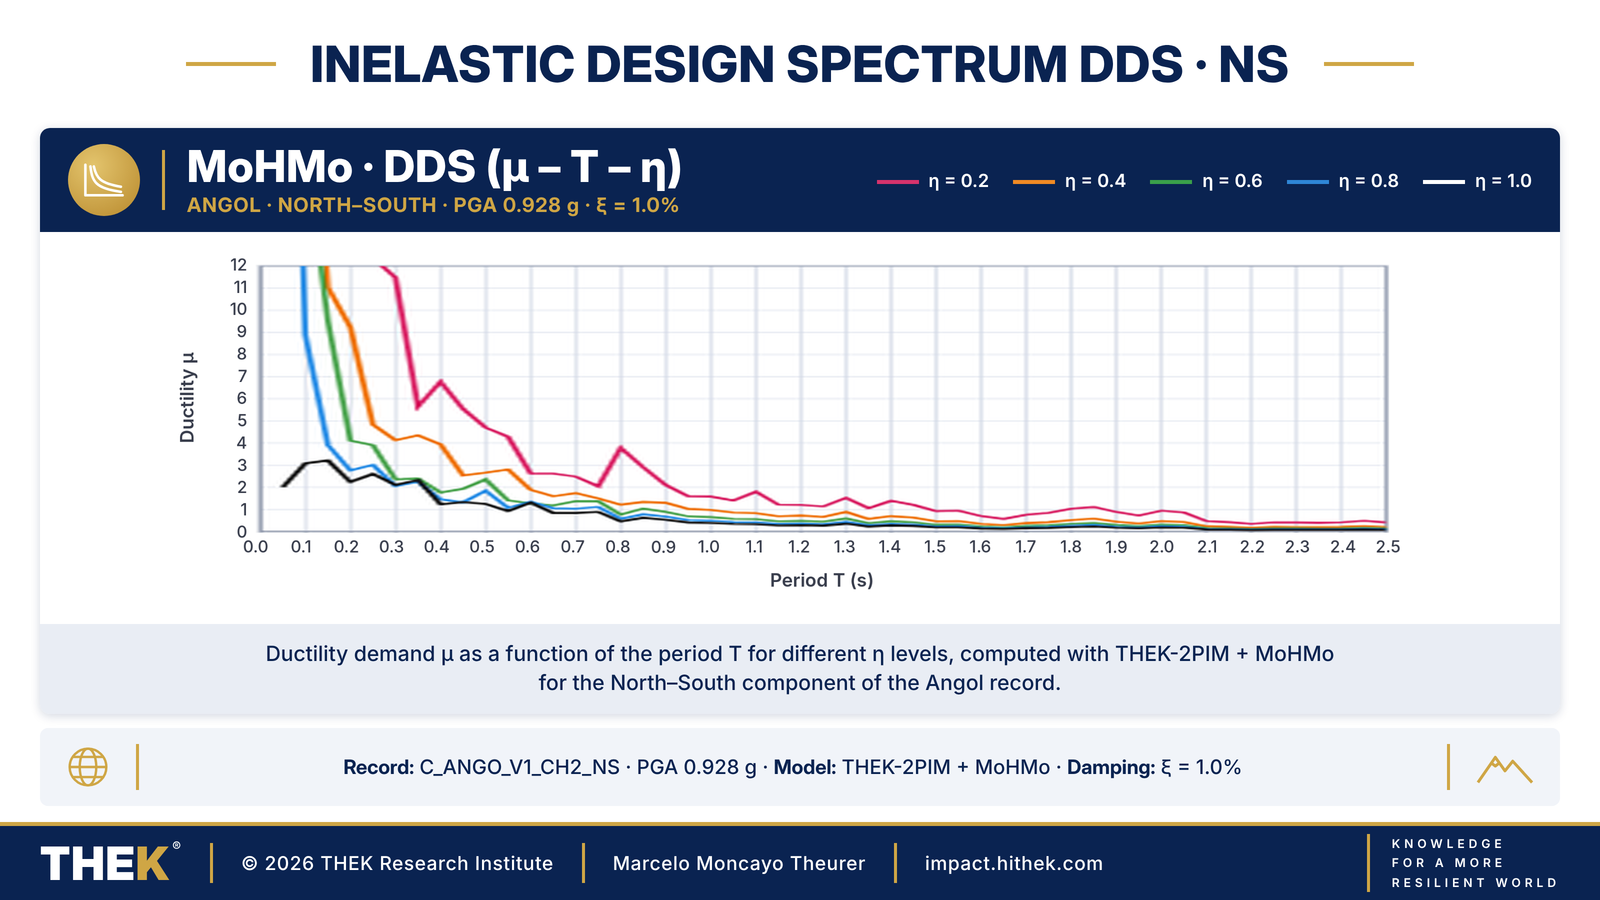
img/THEK_Fig07_Maule2010_DDS_NS.png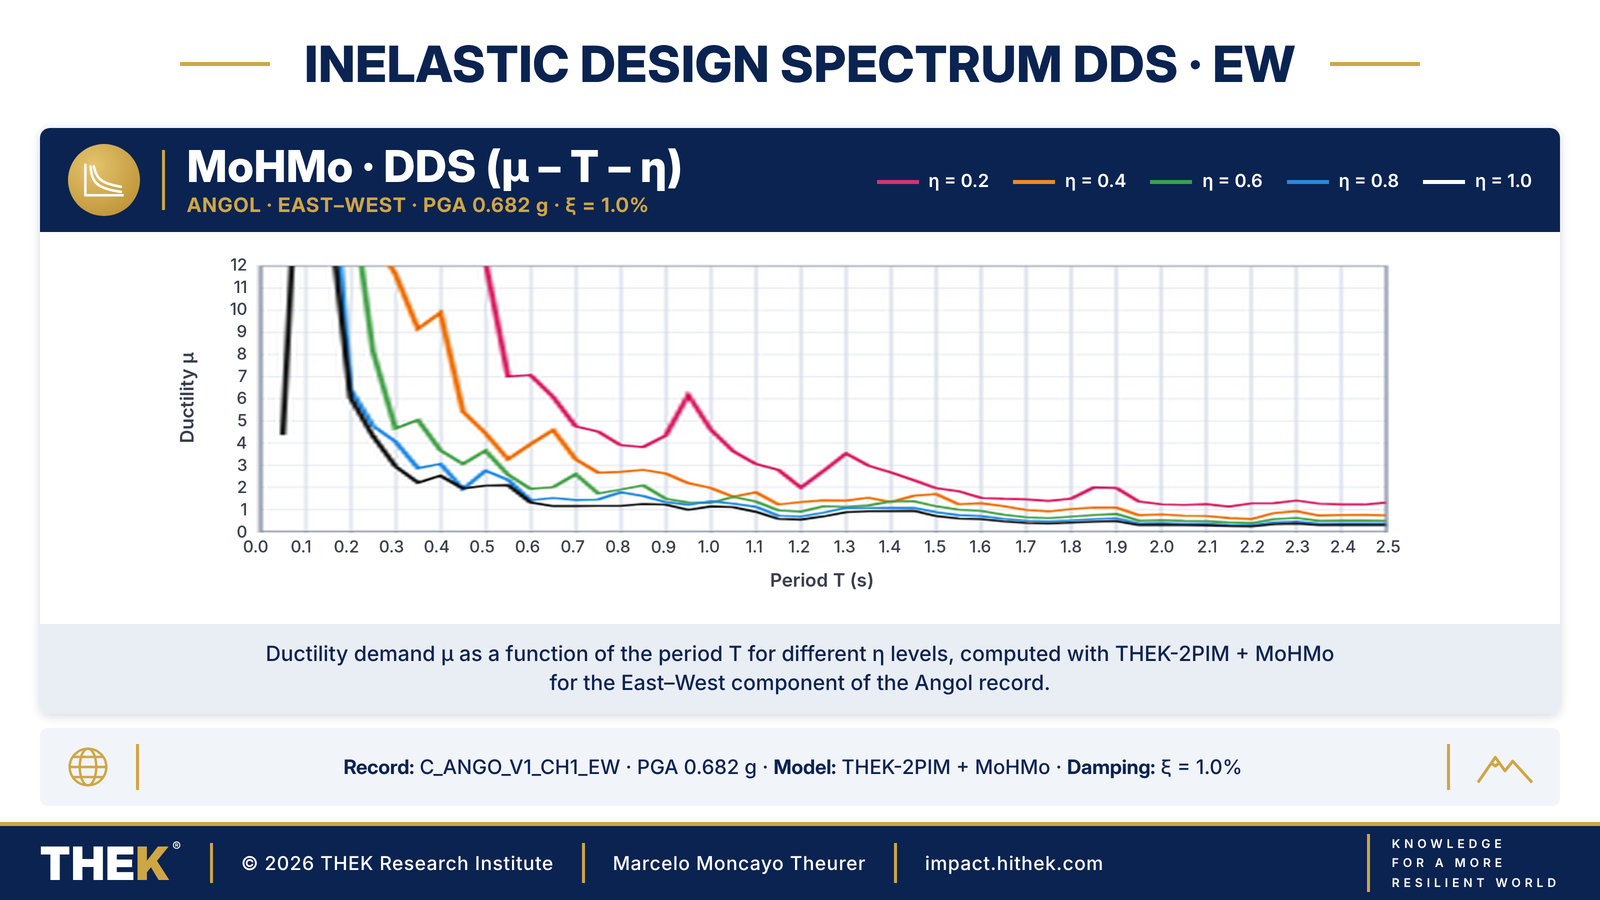
img/THEK_Fig08_Maule2010_DDS_EW.png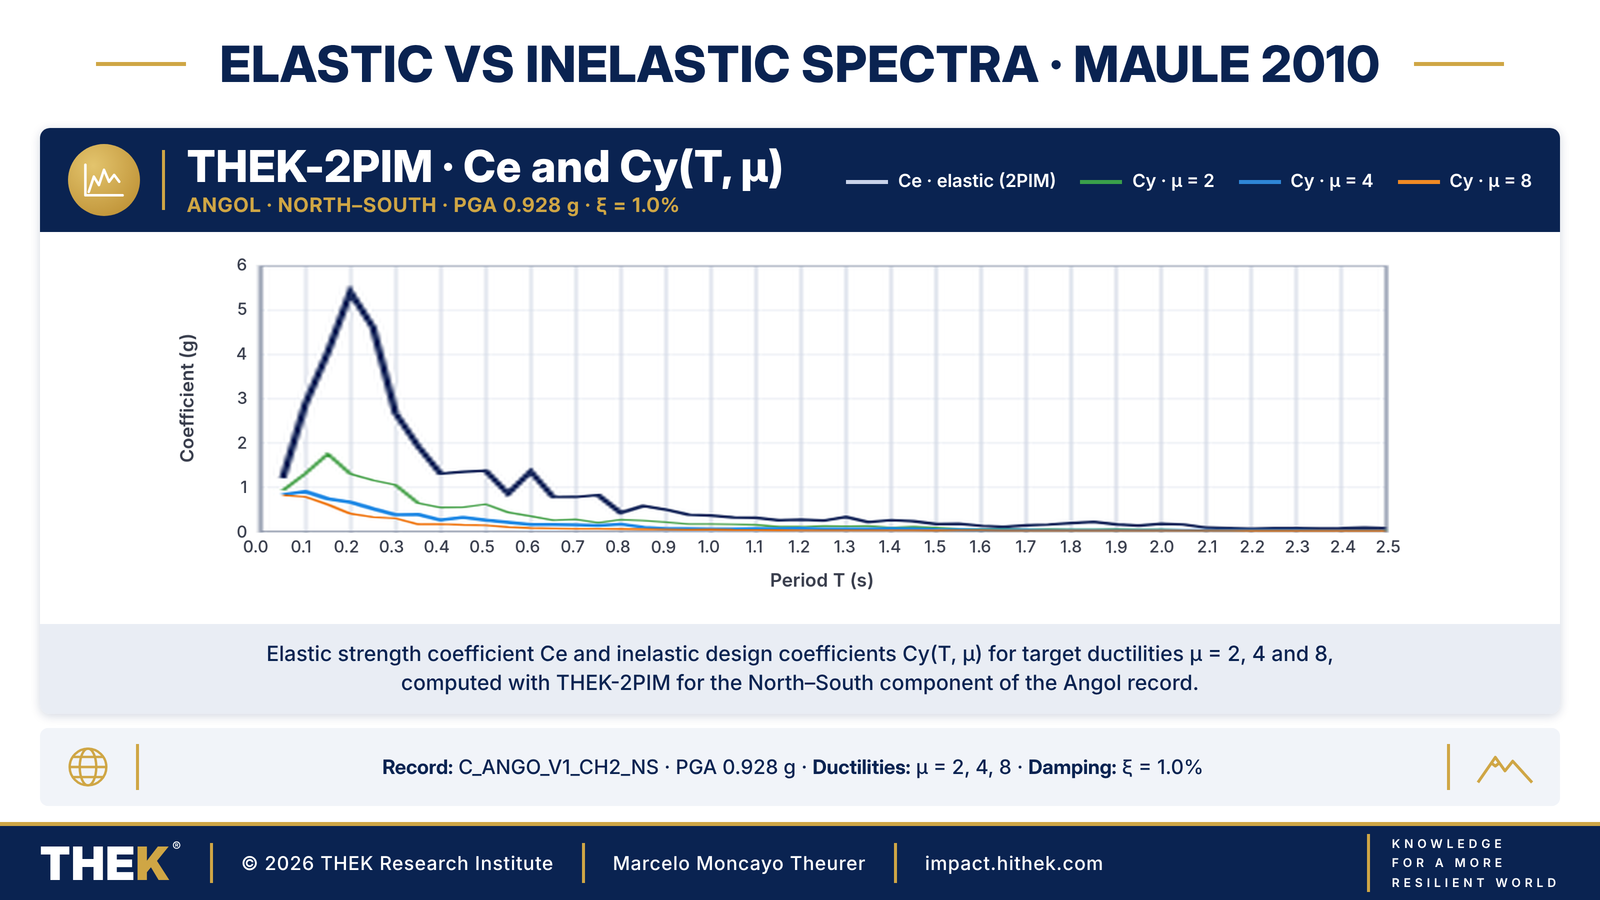
img/THEK_Fig09_Maule2010_Ce_Cy.png7 · Key findings7 · Resultados principales What this case showsLo que muestra este caso
- THEK-2PIM reproduces the Newmark reference. With the same bilinear model, both methods give 137 plastic incursions, a maximum incursion of 33.60 mm vs 33.48 mm and a ductility of 6.45 vs 6.52. THEK-2PIM reproduce la referencia de Newmark. Con el mismo modelo bilineal, ambos métodos dan 137 incursiones plásticas, una máxima incursión de 33,60 mm frente a 33,48 mm y una ductilidad de 6,45 frente a 6,52.
- The structure degrades during the strongest shaking. The MoHMo degradation factor stays at 1.00 until about 40 s, falls in steps to 0.55 at about 54 s, and remains at that value until the end of the record. La estructura se degrada durante el movimiento más fuerte. El factor de degradación MoHMo se mantiene en 1,00 hasta cerca de los 40 s, baja por etapas hasta 0,55 alrededor de los 54 s y permanece en ese valor hasta el final del registro.
- Degradation changes the whole response. With MoHMo there are fewer plastic incursions (122 vs 137), a smaller maximum incursion (29.15 mm vs 33.60 mm), less accumulated plastic deformation (746.2 mm vs 791.4 mm) and a lower ductility (5.53 vs 6.45). La degradación cambia toda la respuesta. Con MoHMo hay menos incursiones plásticas (122 frente a 137), una máxima incursión menor (29,15 mm frente a 33,60 mm), menor deformación plástica acumulada (746,2 mm frente a 791,4 mm) y una ductilidad menor (5,53 frente a 6,45).
- Most of the input energy is dissipated by hysteresis. In the MoHMo model, the hysteretic energy reaches 85% of the energy that the earthquake introduces into the structure (EH / EI = 0.850). La mayor parte de la energía de entrada se disipa por histéresis. En el modelo MoHMo, la energía histerética alcanza el 85% de la energía que el terremoto introduce en la estructura (EH / EI = 0,850).
A model without degradation assumes the structure keeps the same stiffness and strength from beginning to end. MoHMo shows how these properties change during the earthquake, which allows the accumulated damage to be evaluated in a way that traditional bilinear models do not represent. Un modelo sin degradación supone que la estructura mantiene la misma rigidez y resistencia de principio a fin. MoHMo muestra cómo cambian estas propiedades durante el sismo, lo que permite evaluar el daño acumulado de una forma que los modelos bilineales tradicionales no representan.